The $181 Billion Problem: Workplace Safety by the Numbers
Key Takeaways
-
Progress is real but slowing: The US recorded 5,070 fatal work injuries in 2024 (one every 104 minutes) and 2.5 million recordable injuries and illnesses in private industry, both down from 2023.
-
Much of the remaining risk is physical: Falls and contact with objects and equipment killed 1,600 workers in 2024, and 369 more were pedestrians struck by vehicles. These happen where people and hazards share the same space.
-
Over half of OSHA's top citations are visible: In OSHA's latest top-ten list, 54% of citations were for conditions a camera can see, and 71% if you count standards that are partly visible.
-
The cost is a finance conversation: Work injuries cost the US economy $181.4 billion in 2024, or $48,000 per medically consulted injury.
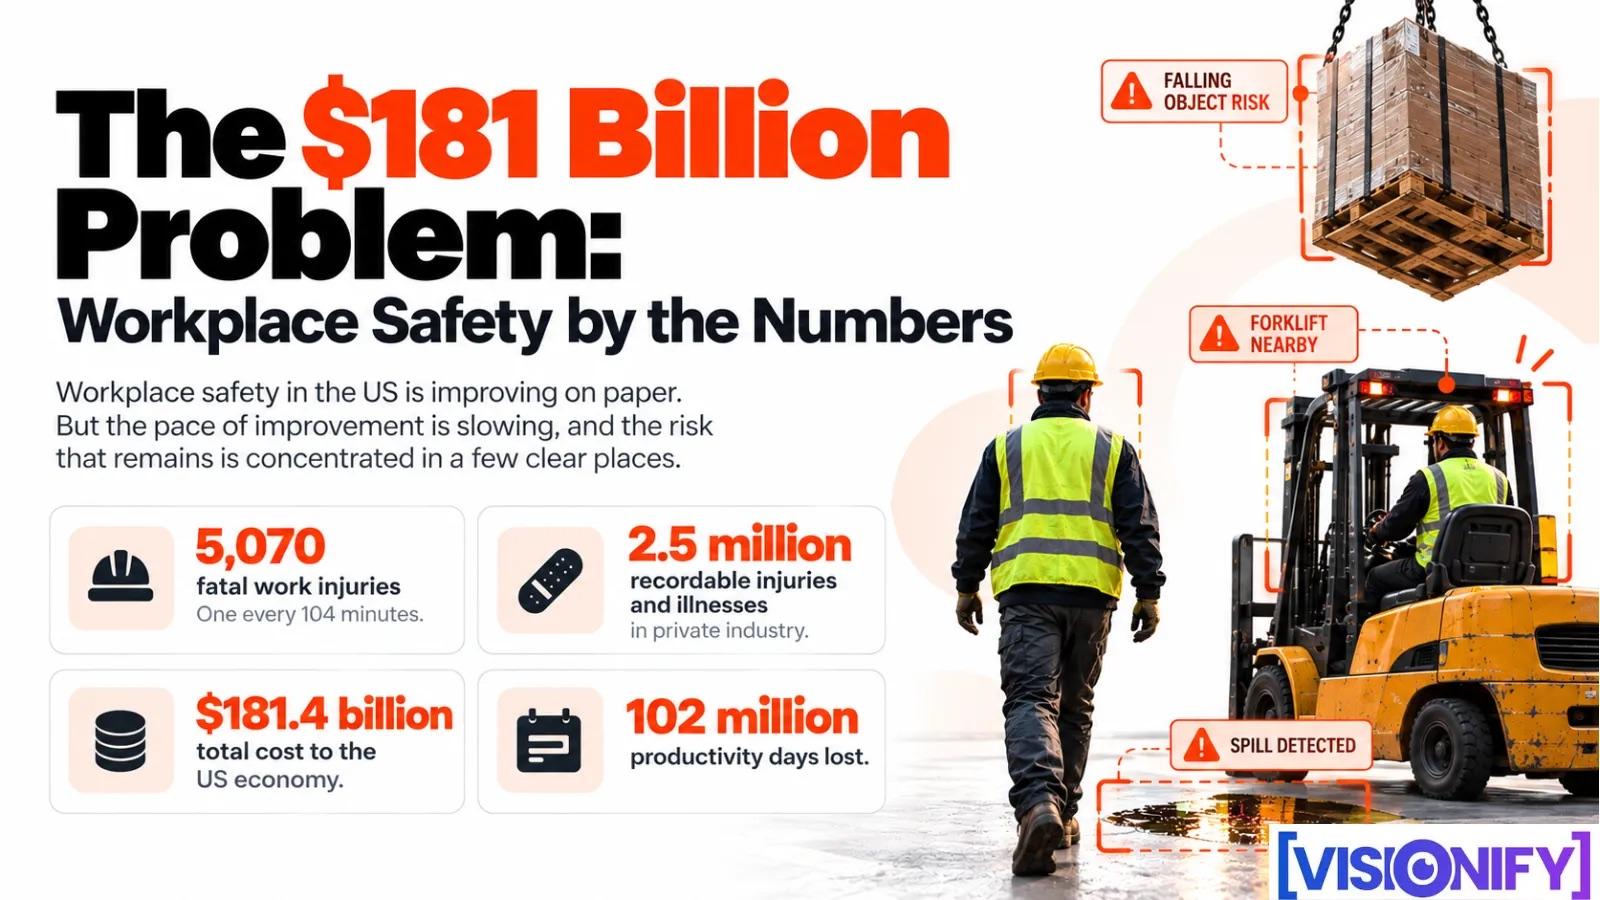
Workplace safety in the US is improving on paper. Private-industry injury and illness counts are the lowest the Bureau of Labor Statistics has recorded since this series began in 2003. But the pace of improvement is slowing, and the risk that remains is concentrated in a few clear places.
In 2024, the US recorded:
- 5,070 fatal work injuries, one every 104 minutes.
- 2.5 million recordable injuries and illnesses in private industry.
- $181.4 billion in total cost to the US economy.
- 102 million days of work lost.
Both injury figures fell from 2023, and that is real progress. The more useful question is what drives the injuries that remain. The federal data answers it more clearly than most people expect.
Where fatal work injuries happen
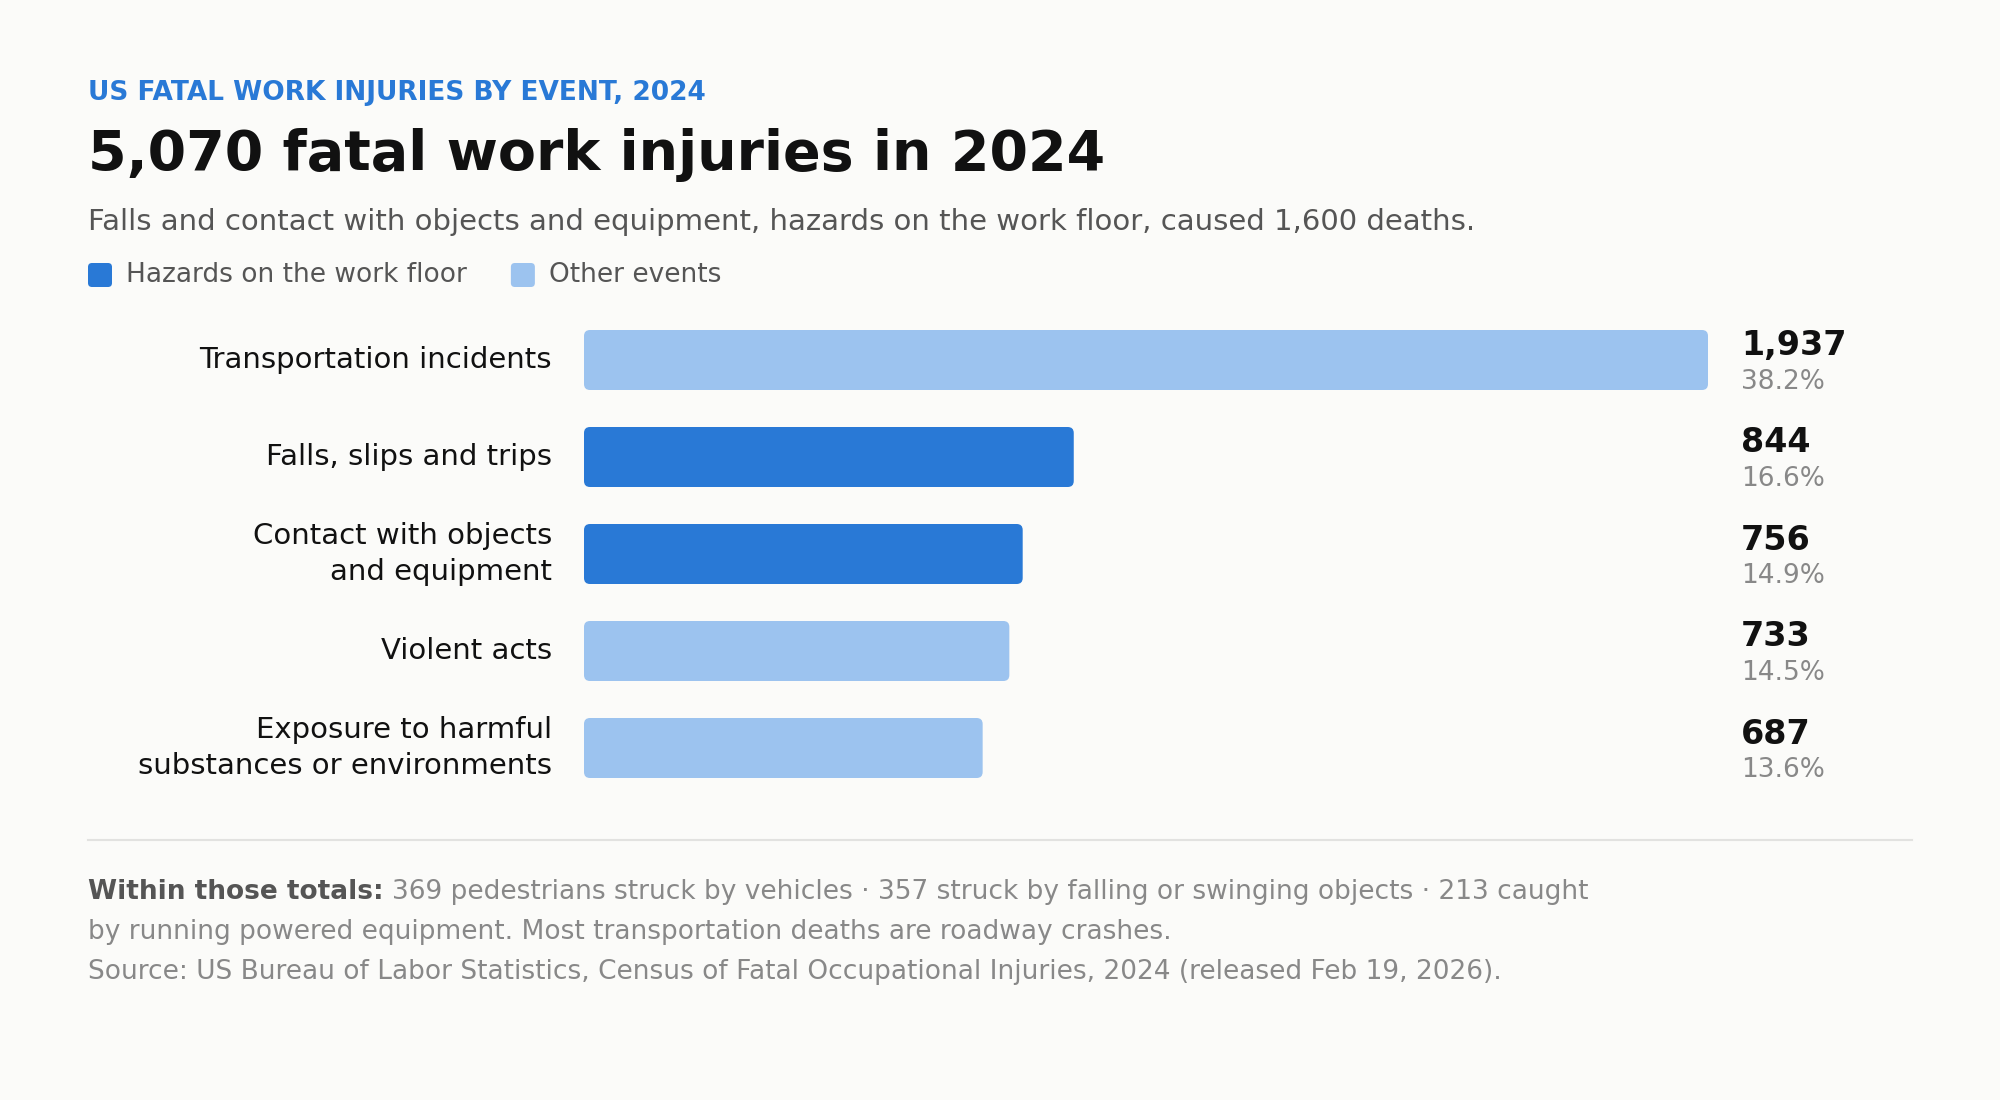
The Bureau of Labor Statistics groups fatal work injuries by the event that caused them. Transportation incidents are by far the largest group, with 1,937 deaths in 2024, or 38.2% of the total. Most of those are roadway crashes, outside any facility. But the category also includes 369 workers struck by vehicles while on foot, up 19% from 2023: the kind of incident that can happen on any loading dock, yard or warehouse aisle.
The five leading events in 2024 were:
- Transportation incidents: 1,937, including 369 pedestrians struck by vehicles.
- Falls, slips and trips: 844.
- Contact with objects and equipment: 756, including 357 workers struck by falling or swinging objects and 213 caught by running powered equipment.
- Violent acts: 733.
- Exposure to harmful substances or environments: 687.
Set aside roadway crashes, violence and chemical exposure, and a pattern appears in what is left. Falls and contact incidents, which together account for 1,600 deaths, plus the 369 pedestrians struck by vehicles, all involve a person and a physical hazard in the same place at the same time. A forklift crosses a walkway. A load swings overhead. A machine runs with its guard open. Someone works at height without a harness. None of these are paperwork failures. They are about where people and hazards meet, and that is something you can see.
What OSHA cites most, and what we found
OSHA publishes its most-cited standards every year. We looked at the latest list, OSHA's preliminary figures for fiscal year 2026 (October 1, 2025 to August 31, 2026), with one question in mind: how many of these violations could a camera see? We haven't seen this number published elsewhere.
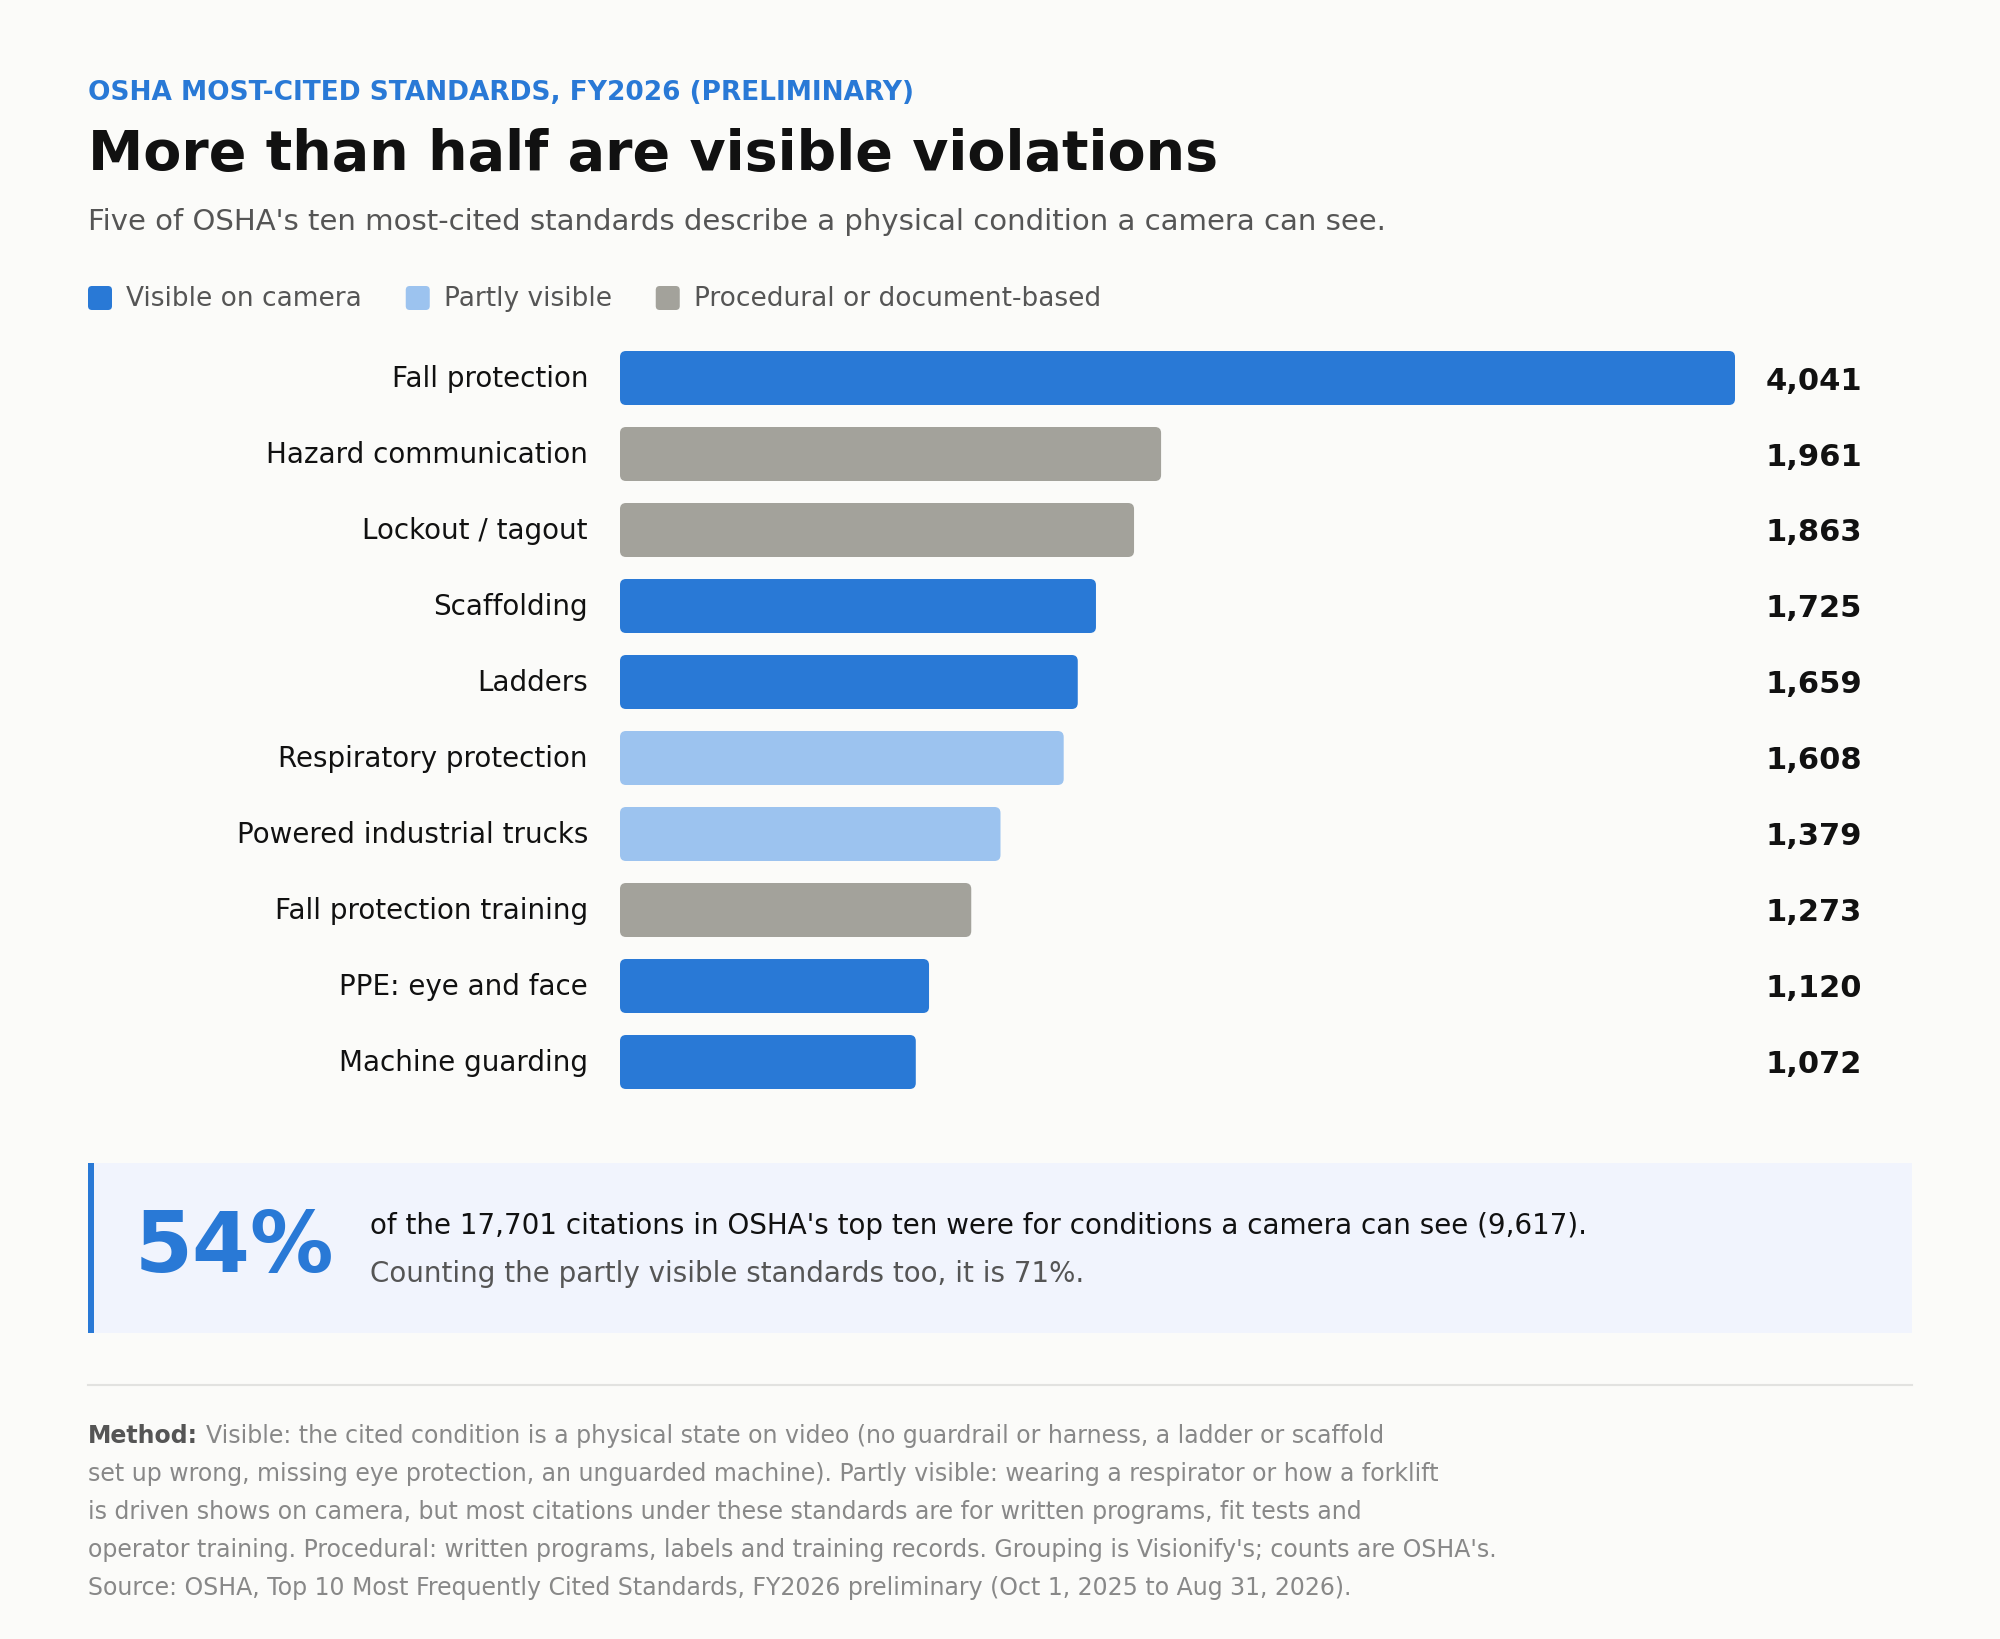
OSHA issued 17,701 citations across its ten most-cited standards. We sorted each standard into one of three groups:
- Visible: the cited condition is a physical state that shows up on video, such as a missing guardrail or harness, a ladder or scaffold set up wrong, a worker without eye protection, or a machine without its guard.
- Partly visible: some of the requirement shows on camera, but most citations are for paperwork. Whether a worker is wearing a respirator is visible; the written program, medical evaluations and fit tests behind it are not. How a forklift is driven is visible; whether the operator was trained and certified is not.
- Procedural: written programs, labeling and training records, which no camera can check.
| Group | Standards | Citations | Share |
|---|---|---|---|
| Visible | 5 | 9,617 | 54.3% |
| Partly visible | 2 | 2,987 | 16.9% |
| Procedural | 3 | 5,097 | 28.8% |
More than half of the citations in OSHA's top ten, 54%, were for conditions a camera can see. Counting the partly visible standards, the share rises to 71%.
The five visible standards were fall protection, scaffolding, ladders, eye and face protection, and machine guarding, which remains the backbone of machine safety on any production floor. Respiratory protection and powered industrial trucks were partly visible. The three procedural standards were hazard communication, lockout/tagout and fall protection training.
For anyone responsible for safety compliance, that changes the question. It is less "what did the audit miss?" and more "what were our cameras already pointed at?" The grouping is ours, not OSHA's, and the full method is at the end of this article so anyone can check it.
What workplace injuries cost
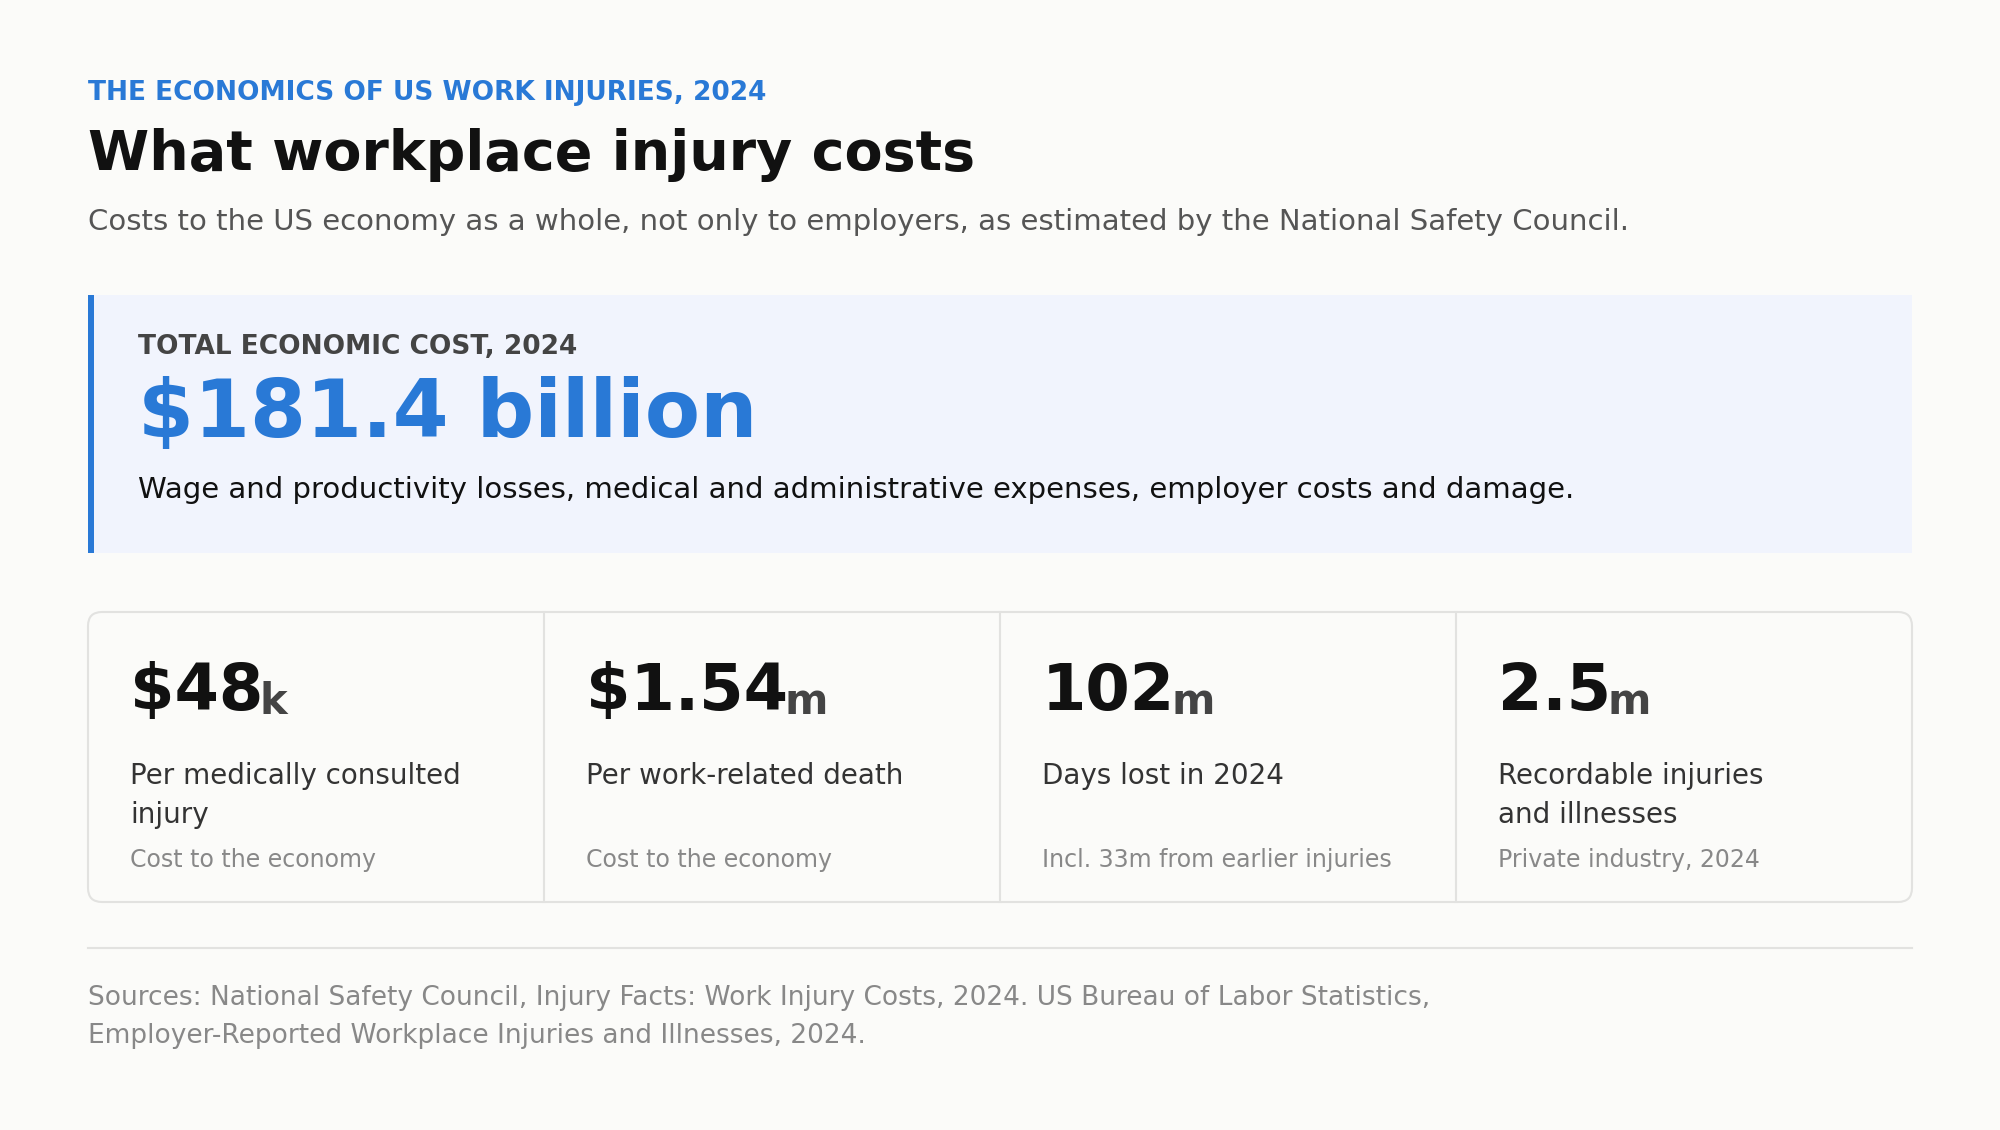
The National Safety Council estimates the full economic cost of work injuries each year. Its estimate goes well beyond medical bills to include lost wages and productivity, administrative expenses, employers' uninsured costs and damage to vehicles and property. These are costs to the US economy as a whole, not only to employers.
In 2024, work injuries cost the US economy $181.4 billion. A medically consulted injury cost $48,000, and a work-related death $1.54 million. Work injuries also cost 102 million days of work in 2024, including 33 million days lost to permanently disabling injuries from earlier years.
At this scale, workplace safety is a finance conversation as much as an EHS one. When a CFO asks what one prevented injury is worth, the NSC's $48,000 is a well-sourced reference point that finance teams already trust. Just be clear that it counts the cost to everyone involved, including the injured worker's lost wages, not only the employer's bill.
Why near-miss reporting is not enough
If the hazards are visible and the costs are high, why has progress slowed? Part of the answer is that the industry's favorite leading indicator does not work the way it is usually described.
Most safety professionals have seen the safety triangle. It comes from Heinrich in 1931 and from Frank Bird's later study of 1.7 million incident reports. Bird's version claims a fixed ratio: for every serious injury there are 10 minor injuries, 30 property-damage incidents and 600 near-misses. The implication is that if you reduce the small events, the serious ones will fall in proportion.
The research since then does not support that. Studies in US and Chilean mining, and across Dutch industry, found that the ratios change from sector to sector. Sites with low rates of minor incidents were no less likely to have a fatal one. The causes also differ: minor injuries tend to come from everyday slips and strains, while serious incidents tend to come from several safeguards failing at once. BP's Texas City refinery and Esso's Longford gas plant both had strong injury records right up until their explosions.
So "report more near-misses" is not a strategy on its own. The useful version is narrower:
You can't act on a risk you never recorded, and many of the risks behind serious injuries are ones a camera can see.
Near-miss reporting also has practical limits that no amount of encouragement fully fixes:
- It depends on someone choosing to write up an event where nobody got hurt.
- It usually happens at the end of a shift, often on paper, long after the details have faded.
- Most near-misses are not hidden; they simply never get written down.
- Supervisors and auditors can only watch a small part of a site at any one time.
Why AI safety monitoring became practical
AI safety monitoring software is not a new idea. What changed is that three barriers fell at roughly the same time.
The first was the detection models. Spotting a missing hard hat or a spill used to mean collecting thousands of site-specific images and spending months on training. Pre-trained models for common hazards now work from the first day, with tuning for each site rather than a build from scratch.
The second was where the processing happens. The software now runs on a server inside the plant, so video stays on the local network and alerts arrive in under a second. That removes one of the first objections most IT teams raise.
The third was the cameras. Modern systems read standard RTSP streams from the IP cameras most sites already have. When no new hardware is needed, the business case looks very different. A rollout that once took a year and a capital request can now have a first site live within a week.
For how the technology works in practice, see our complete guide to vision AI for workplace safety.
What customers report
Published customer results show what is achievable when monitoring is in place and someone acts on the alerts:
- Henkel: 72% fewer safety incidents across its manufacturing operations.
- Hexion: 80% faster spill response, from an average of 47 minutes to under 10, with 92% of detected spills contained before they escalated.
- Indorama Ventures: 65% fewer safety incidents and 94% PPE compliance in high-risk zones.
- E-commerce distribution center: 76% fewer OSHA-recordable incidents and 82% fewer forklift-related safety events.
These results are customer-reported, and outcomes vary by site. But they line up with the national data. The biggest gains show up where hazards are physical and repetitive: vehicles moving near people, forklift-pedestrian near-misses, spills on walking surfaces, and PPE compliance monitoring in clearly defined zones. Those are the same categories that stand out in both the BLS figures and OSHA's citation list. For how to measure results like these on your own site, see The Impact of AI on Workplace Safety.
What monitoring will not do
Any honest look at this data has to include the limits. Monitoring is a tool, not a fix on its own.
It will not create accountability. If nobody acts on alerts, monitoring becomes an expensive noticeboard. It will not be perfect either: poor lighting, blocked views and unusual angles cause false alerts, so accuracy should be measured through human review and reported openly. And it will not replace walking the floor. Cameras only see what is in frame, and they cannot smell a leak or notice a loose fastening on a guard.
Monitoring also won't answer the workforce question by itself. People on the floor will reasonably ask whether this will be used against them. The answers that work are practical ones: faces blurred, video kept on site, and alerts sent to the shift supervisor rather than HR.
Where this is heading
Detecting a missing hard hat is fast becoming standard, and within a couple of years it will simply be expected. The harder problem now is interpretation. Safety leaders want to know why one line's numbers changed, whether a shift in the data is a real trend or the result of a settings change three weeks ago, which corrective actions have gone stale, and how strong the evidence is behind each decision.
Which brings us back to OSHA's list. More than half of the most-cited violations, and many of the hazards behind fatal work injuries, are visible ones. The question for the next few years is not whether software can see them. It is whether anyone acts on what it sees.
Methodology
We grouped OSHA's ten most-cited standards for FY2026 (preliminary data, October 1, 2025 to August 31, 2026) by whether the cited condition is a physical state visible on video, partly visible, or a procedural or documentation requirement.
- Visible: fall protection (1926.501), scaffolding (1926.451), ladders (1926.1053), eye and face protection (1926.102) and machine guarding (1910.212).
- Partly visible: respiratory protection (1910.134) and powered industrial trucks (1910.178). Use of a respirator and how a truck is operated can be seen on camera, but citations under both standards are mostly for written programs, medical evaluations, fit testing, and operator training and certification.
- Procedural: hazard communication (1910.1200), lockout/tagout (1910.147) and fall protection training (1926.503).
Citation counts are OSHA's and may change when OSHA finalizes the fiscal year. The grouping is ours, and we welcome challenge. Injury figures come from the US Bureau of Labor Statistics for 2024, and cost figures from the National Safety Council for 2024. Customer results are self-reported and published on visionify.ai.
Sources
- US Bureau of Labor Statistics, National Census of Fatal Occupational Injuries in 2024 (bls.gov/news.release/cfoi.nr0.htm)
- US Bureau of Labor Statistics, Employer-Reported Workplace Injuries and Illnesses, 2024 (bls.gov/news.release/osh.nr0.htm)
- National Safety Council, Injury Facts: Work Injury Costs (injuryfacts.nsc.org/work/costs/work-injury-costs)
- OSHA, Top 10 Most Frequently Cited Standards, FY2026 preliminary (osha.gov/top10citedstandards)
- Risk Engineering, The Heinrich/Bird accident pyramid (risk-engineering.org)
Frequently Asked Questions
Find answers to common questions about this topic
Want to learn more?
Discover how our Vision AI safety solutions can transform your workplace safety.
Book a DemoSchedule a Meeting
Book a personalized demo with our product specialists to see how our AI safety solutions can work for your business.
Choose a convenient time
Select from available slots in your timezone
30-minute consultation
Brief but comprehensive overview of our solutions
Meet our product experts
Get answers to your specific questions